triplethumb.jpg
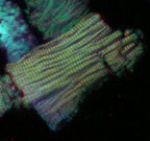
This cardiomyocyte has been stained with three different labels to show sarcomeric structure. The colors shown represent tropomodulin (blue), alpha-actinin (red), and actin filaments (green). Both tropomodulin and alpha-actinin were labeled with antibodies, whereas actin filaments were labeled with fluorescent-tagged phalloidin.
triple3thumb.jpg
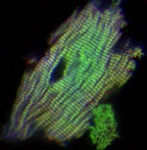
This cardiomyocyte has been stained with three different labels to show sarcomeric structure. The colors shown represent tropomodulin (blue), alpha-actinin (red), and actin filaments (green). Both tropomodulin and alpha-actinin were labeled with antibodies, whereas actin filaments were labeled with fluorescent-tagged phalloidin.
trgthumb.jpg
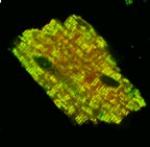
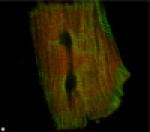
This is another single cardiomyocyte, but this cell was isolated from the heart of a transgenic mouse which overexpresses tropomodulin. Like the cell shown above, it has been labeled with antibodies to tropomodulin (green) and alpha-actinin (red). The normal alternating pattern of tropomodulin and alpha-actinin immunoreactivity has been disturbed. The yellow color indicates colocalization of both red and green labels (an abnormal distribution). Transgenic mice with this level of tropomodulin overexpression suffer from cardiomyopathy, and our ongoing studies are directed at understanding the mechanism of cardiac failure in these mice.
transthumb.jpg
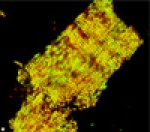
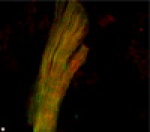
A cardiomyocyte from a transgenic mouse showing accumulation of tropomodulin. This cell shows accumulation of tropomodulin reactivity which appears to accululate in patches along the length of the myofibrils. This cell is likely to have been in the process of myofibril degeneration.
jcicover.jpg
The research report describing our tropomodulin transgenic mice is the featured cover article in the Journal of Clinical Investigation published in January 1998 (Volume 101, number 1, pages 51-61).
hearts.jpg
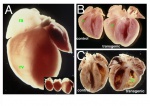
These are views of hearts from transgenic mice which overexpress tropomodulin compared to nontransgenic control mice. The most prominent feature in a transgenic heart (A) is marked enlargement of the right atrium (ra) and right ventricle (rv). The right ventricle is translucent due to thinning of the wall, and the heart is significantly larger than control hearts from nontransgenic siblings (A, inset, transgenic heart on right with two nontransgenic hearts). Age matched hearts (B) from control and transgenic mice are bisected (without prior fixation) to show significant increases in chamber sizes throughout the heart, particularly dilation of the right ventricle. Size matched hearts (C) from a 14 week old control and 3.5 week old transgenic mouse are bisected (after formalin fixation) to show overall thinning of myocardium, dilation of chambers, and thrombus formation in the left atrium.
hand.jpg
A normal cardiomyocyte labeled with antibodies to alpha-actinin (red) and tropomodulin (green) rotated 30 degrees off axis from the X-Y plane of original viewing. The close packing and parallel alignment of myofibrils is clearly evident in this cell.
dissocconthumb.jpg
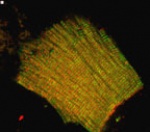
This is a single cardiomyocyte isolated from the heart of a normal mouse which has been labeled with antibodies to two different proteins which are normally present in myofibrils. The alternating bands of tropomodulin (green) and alpha-actinin (red) show the dense packing of myofibril throughout the interior of the cell.
contthumb.jpg
A normal cardiomyocyte labeled with antibodies to alpha-actinin (red) and tropomodulin (green) rotated 30 degrees off axis from the X-Y plane of original viewing. The close packing and parallel alignment of myofibrils is clearly evident in this cell.
CircRescoverthumb.jpg
The research report describing our work on the effect of altered tropomodulin expression upon myofibril structure in cardiomyocytes is the featured article in Circulation Research published in January 1998 (Volume 82, number 1, pages 94-105).
030907NICD6dCSCs_Fig1_smaller.jpg
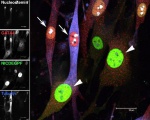
Cardiac progenitor cells infected with activated Notch adenovirus (NICDEGFP, green) for six days immunostained for GATA4 (red), Nucleostemin (white) and Tubulin (blue). White arrows point to cells with low levels of NICDEGFP, positive for Nucleostemin and GATA4. White arrowheads point to cells with strong NICDEGFP expression and low levels of Nucleostemin and GATA4. March 2007.
HesNotTubMHCstem_smaller.jpg
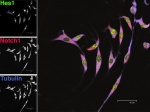
Immunostaining of Hes1 (green), Notch1 (red) and Tubulin (blue) in cardiac progenitor cells isolated from aMHC-GFP transgenic mouse hearts. April 2007.
CkitTencCNICDInfarct_smaller.jpg
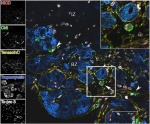
Immunolocalization of activated Notch (NICD, red), c-kit (green), tenascin-C (yellow), tropomyosin (blue) and To-pro 3 (white) infarcted mouse myocardium four days post infarction. White arrow points to c-kit+ cell expressing activated Notch, shown enlarged in upper right corner. Larger white arrowheads point to c-kit+ cells lacking NICD, and small white arrowheads point to border zone myocytes expressing NICD. BZ and IZ denote border zone and infarct zone respectively. March 2008.
CirculationResearchCoverDetailAugust2006.gif
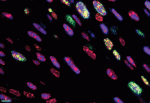
Myocyte proliferation in 2-day-old nontransgenic myocardium as indicated by colocalization of Ki67 (green), GATA4 (blue), and Topro-3 iodide (red). This proliferation is enhanced later in development in hearts of mice expressing Akt in cardiomyocyte nuclei.

