
 |
|||
 |
|
||
 |
|
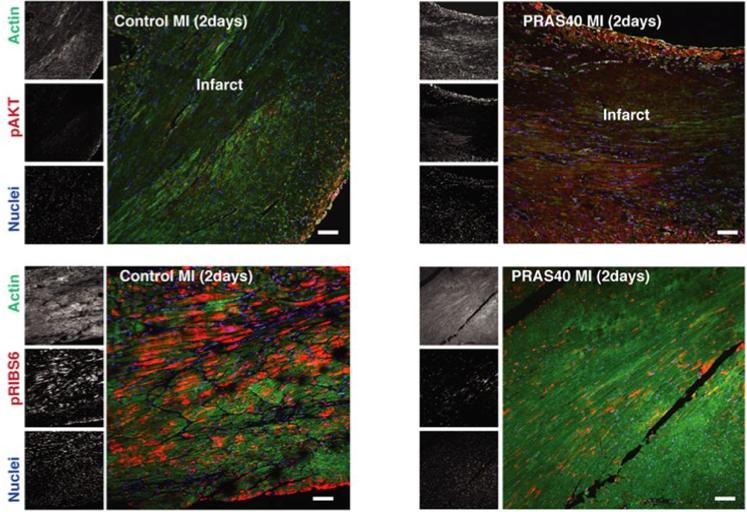
| Paraffin-embedded sections from control hearts and PRAS40-treated hearts 2 days after MI stained for pAkt473 (red), actin (green), and nuclei (blue) and assessed by confocal microscopy. D, Sections of control hearts and PRAS40-treated hearts 2 days after MI stained for pRibS6 (red), actin (green), and nuclei (blue) and assessed by confocal microscopy. Bar, 150 µm. F, PRAS40 overexpression increases Akt phosphorylation in myocytes by confocal microscopy of myocardial sections at 6 weeks after surgery. Bar, 50 µm. Number of mice per group is indicated in the bar. |
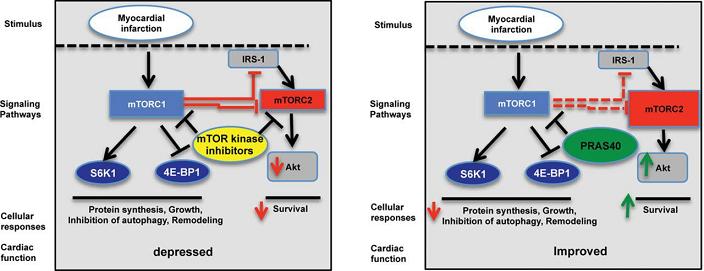 |
| Our model for PRAS40-mediated cardioprotection. mechanistic target of rapamycin (mTOR) kinase inhibitors or impairment of mTOR complex 2 (mTORC2) function worsens cardiac function after myocardial infarction. |
 |
|||
 |
|
 |
|
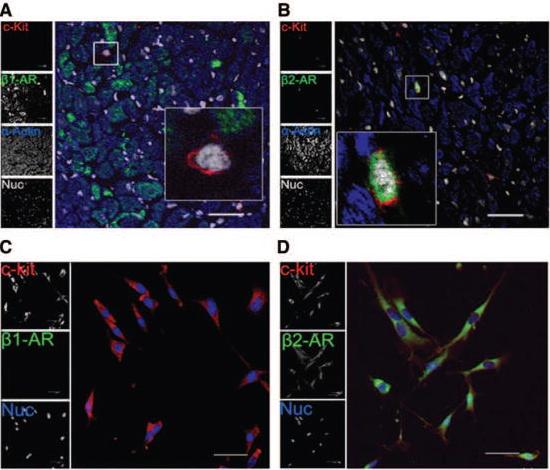 |
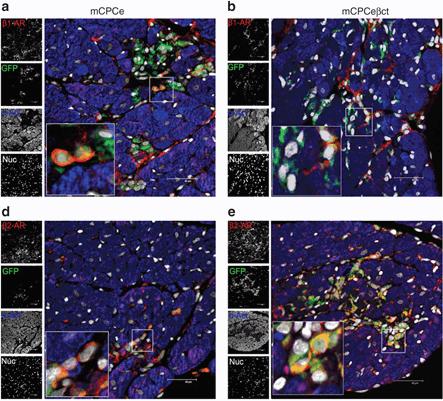
A and B, Myocardial sections from mouse heart show c-kit+ CPCs (red) are ß1-AR (-) and ß2-AR (+) (green) and nuclei (white) (n=3). C and D, Cultured CPCs express c-kit (red) and ß2-AR (green) but not ß1-AR. Nuclei are shown in blue. Scale bar, 40 µm. |
|
|
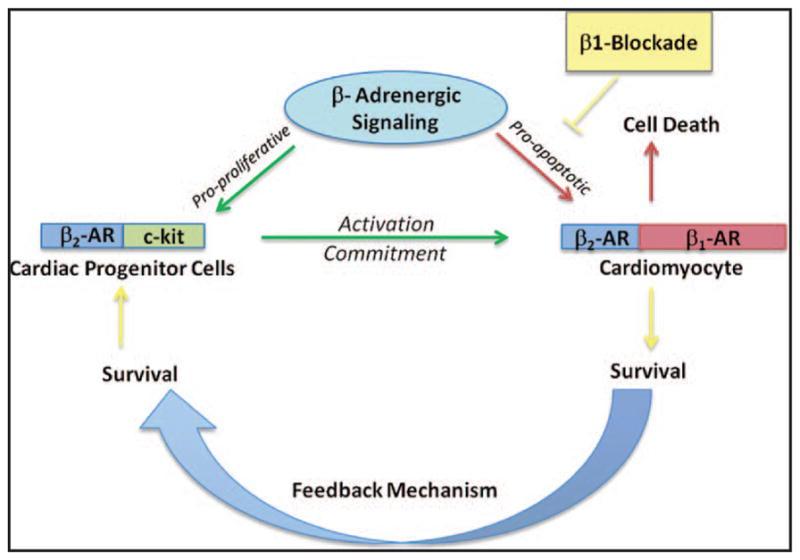 |
Our schematic representation of cardiac stem cell cycling in response to ß-adrenergic signaling. |
|
|
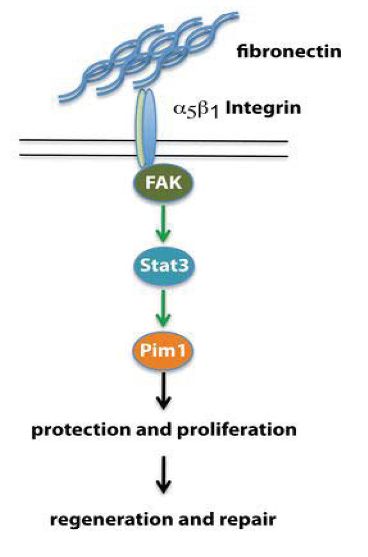 |
Our schematic that describes Fn-ß1 integrin-FAK-Stat3-Pim1 pathway mediating proliferation and protection of CPCs leading to regeneration and repair. |
 |
|
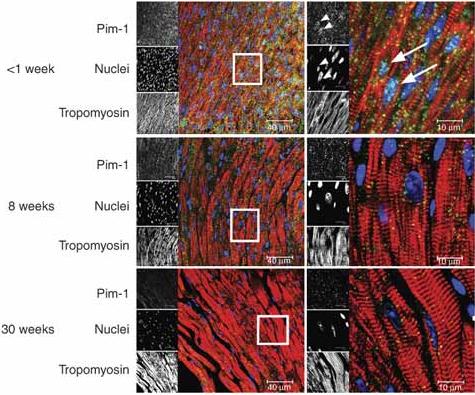 |
Representative confocal micrographs of paraffin-embedded sections from wild-type mouse hearts at |
|
|
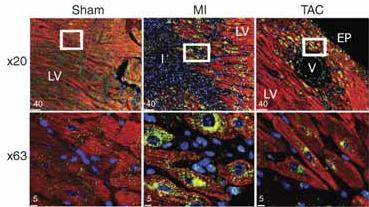 |
Representative confocal micrographs of 4-d sham, MI and TAC mouse hearts labeled for Pim-1 (green), tropomyosin (red) and nuclei (blue) at 20 (top row) and 63 (bottom row) magnification of areas boxed in top panels. LV, left ventricle; I, infarct; EP, epicardium; V, vessel. Bars, 40 m, top; 5 m, bottom; n = 6. |
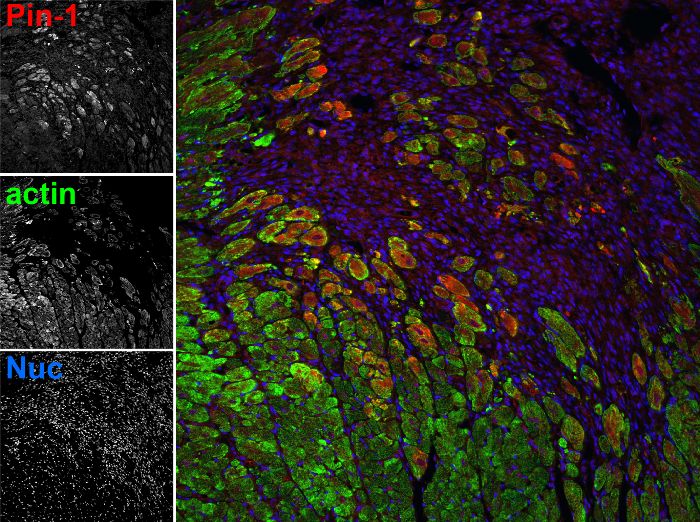 |
Cardiac myocytes (green) in the border zone express Pin1 (red) at 7 days following myocardial infarction injury. |
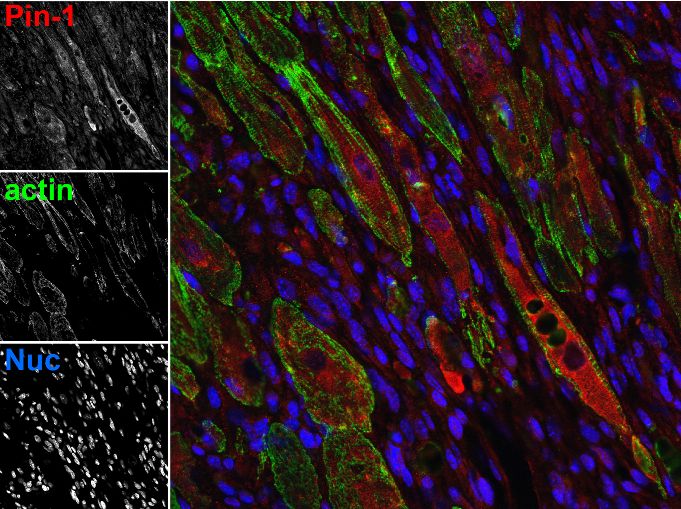 |
Pin1 expression is mainly cytosolic in cardiac myocytes in the border zone of a myocardial infarct at 7 days after injury. |